The 12 Laws of AI – Law 9: The Law of Data Enlightenment
December 18, 2023
The following is part of our blog series “The 12 Laws of AI.” The series is a set of practical and philosophical guidelines for DMOs to work from as they explore the opportunities and challenges of artificial intelligence (AI). Check out the previous blog in this series, “The 12 Laws of AI – Law 8: The Law of Constructive Command.”
Law 9: The Law of Data Enlightenment
AI stands as both lantern and sage in the quest to extract insights from unrefined information. With meticulous precision, it navigates the amassed annals, revealing insights akin to age-old revelations. As ancient libraries once guided the scholar, AI traverses the vast corridors of spreadsheet wisdom, ushering us toward an elevated comprehension of what lies within.
“We are drowning in information but starved for knowledge.”
John Naisbitt

In the past ten years, the DMO industry has undergone a sea of change with new data sources and platforms to aggregate and help us build insights, with an expectation that we better demonstrate the connection between budgets and critical business outcomes.
Today, most DMOs are investing in multiple information sources, including geolocation data, hotel and short-term rental data, visitor spending, and more. Additionally, many of you have brought on 3rd party data aggregators (think Madden’s Voyage or Tourism Economics’ Symphony platform) to get this data into one central location and make building insights more efficient and effective.
Yet the problem persists: we have all the data, it’s in one place, and we have charts and graphs to illustrate the current situation and trends in our destination…but ultimately, most of us still suffer the dreaded “paralysis by analysis.” What does any of it mean? What are the narratives in the spreadsheets and charts I have available? Many of the third-party services offer data analysis services, and before the pandemic, hiring data positions was becoming a thing. However, an entry-level data analytics position can cost upwards of $70-90k a year, prohibitively for most DMO budgets. Often the questions and insights we need are simple, but we need a little help getting them in a decent amount of time and having the flexibility to tailor the answer to a specific need. Enter, you guessed it, AI.
Much of the buzz about AI centers on content creation. However, these tools (especially chatbots like the eponymous ChatGPT and Google Bard) are equally adept at breaking down a spreadsheet of information and pulling contextualized, actionable insights in moments. In much the same way that these same tools have made coding ‘easy’ for even the layperson to perform, performing routine data analysis tasks is now something anyone can do using a framework of asking good questions supported by a solid prompt command structure.
Let’s look at a little bit of what’s possible, but first, a word of caution: as we discussed in Law 4: The Law of the Imperfect Mirror, AI tools can and will make mistakes occasionally. Those mistakes can be problematic when dealing with data, so it’s critical that you always perform your due diligence with data analysis performed by AI. A personal rule of thumb is to increase the level of scrutiny of any AI analysis commensurate to how public or critical that data will be in guiding actions. If something goes out to a board of directors or the public, it’s worth checking as many data points as possible and ensuring the insights pass the eye test. If you think about it, this is the same as how we should act with human-based analysis. After all, to err is human, too.
AI-Powered Data Analysis
Let’s explore just a few of the options (and quick examples) available for AI-powered data analysis:
- Trend analysis: “Analyze the seasonality of visitor length of story over the past five years.”
- Sentiment analysis: “Conduct a sentiment analysis and summary of recent reviews about Visit Smithville.”
- Competitive analysis: “Compare the media spending of our competitors during the past two years.”
- Forecasting: “Using visitor numbers from the past three years, please forecast expected visitation for next summer considering current economic conditions and expected visitor trends.”
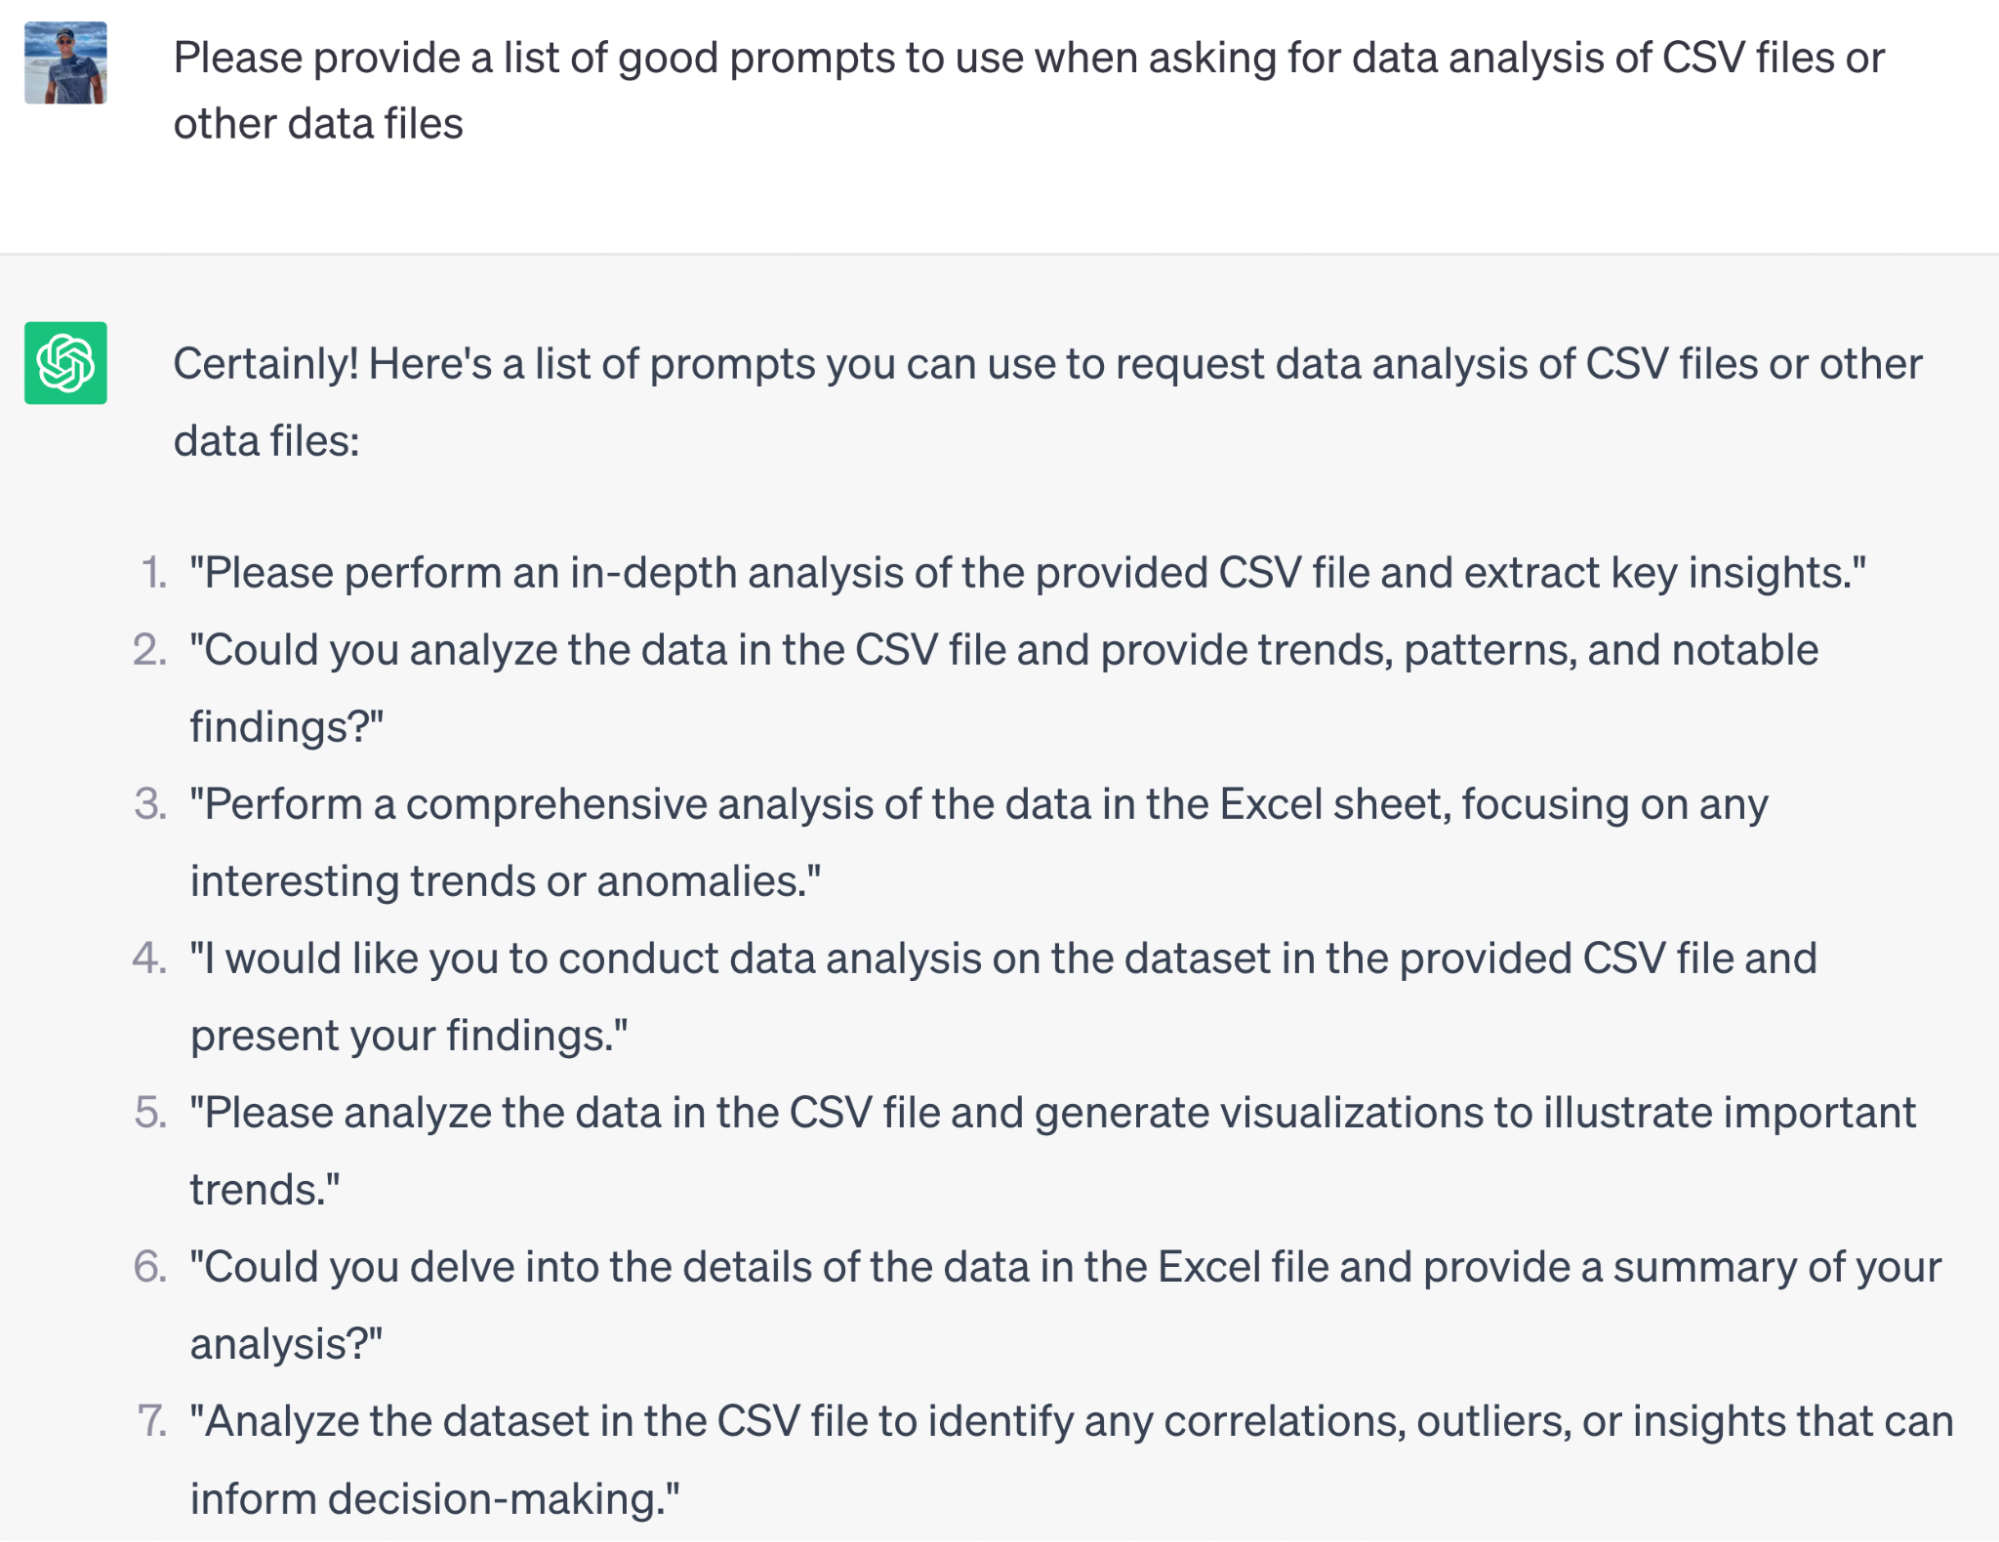
In addition to these general areas of analysis, you can also drop in data straight from a spreadsheet and ask ChatGPT, for instance, to perform any number of tasks on the data. Here’s a list (straight from the source) of prompts you can use for that purpose:

Here at Madden, in addition to assisting with general data analysis questions, we recently employed these tools to quickly summarize the hundreds of responses collected in a company culture and values team member survey to understand better where we are as an organization and how we can improve. This was a great aid to our HR and leadership team, saving a significant amount of time and greatly improving the value of the exercise.
Let’s work through an exercise that will illustrate just one way to use the power of AI to enable you to become a data insights guru in no time!
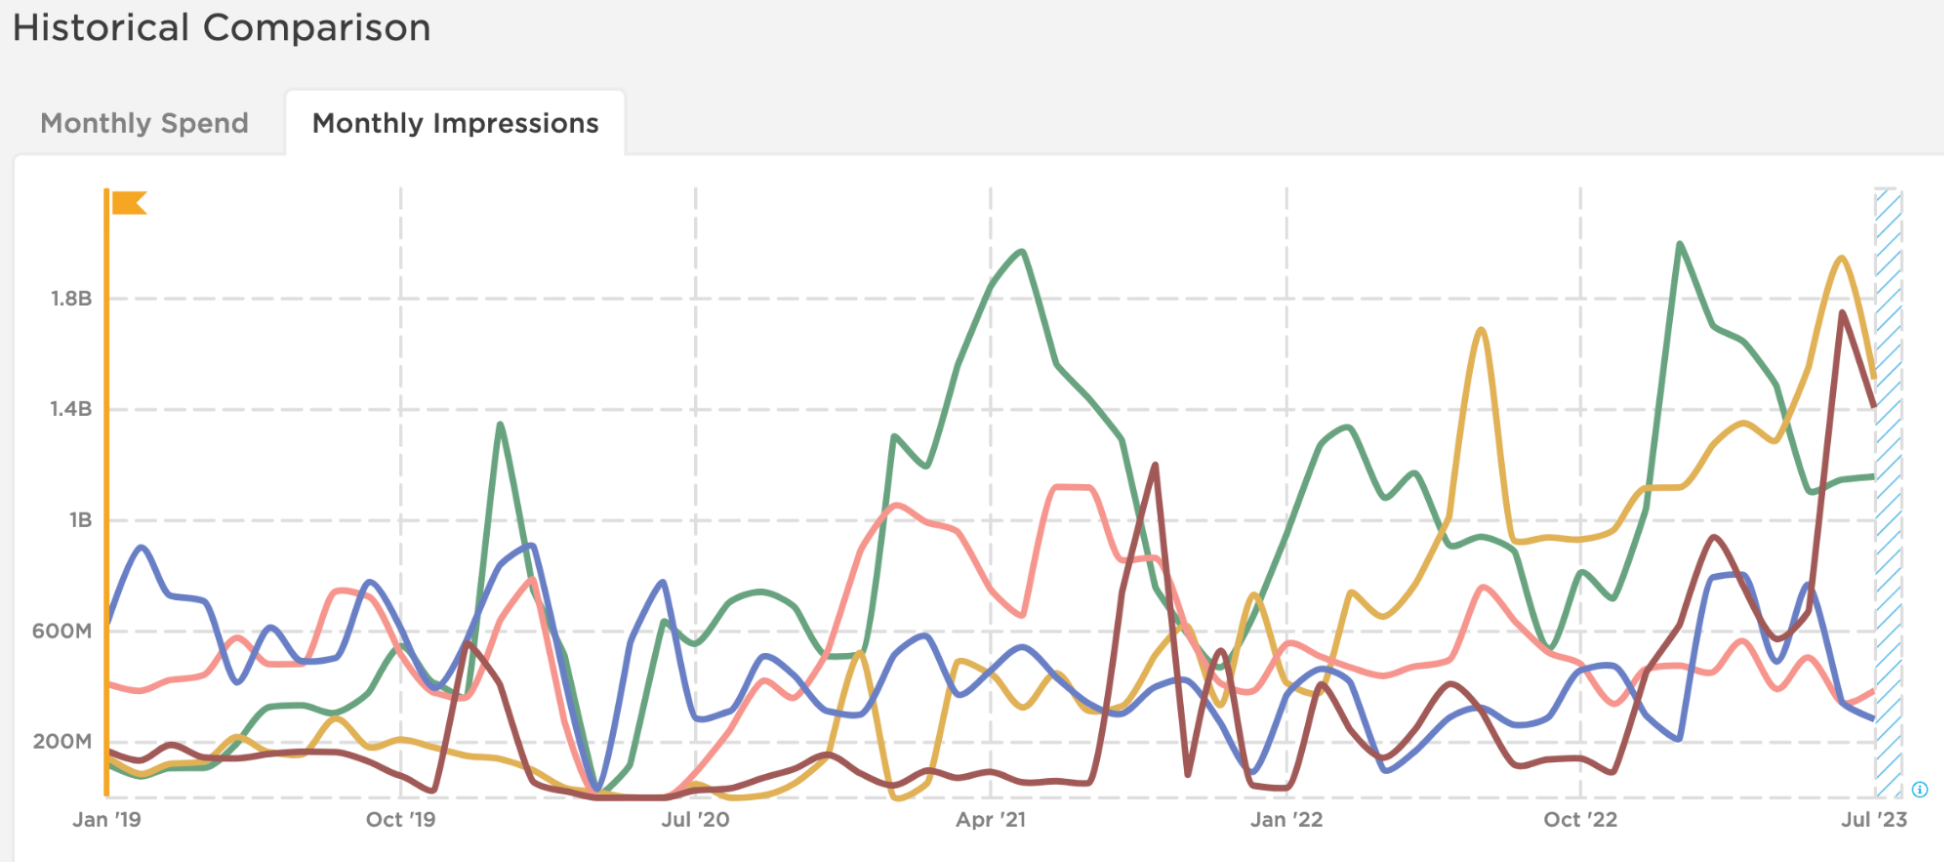
For this example, we’ll pretend we’re doing competitive research for Visit Smithville. We’re interested in learning more about how our DMO competitive set are allocating their media budgets with regards to seasonality and media channel distribution. We start by using our intelligence resources (in this case, competitive media data available in Madden’s Voyage platform) to visualize captured competitor media spending across the past few years:

We’re all familiar with charts that look like that one, right?! For those who don’t have a data science degree or read statistics books on Sunday mornings…decoding the information in that chart could be very overwhelming. Fortunately, we don’t have to, as we will have ChatGPT do the heavy lifting.
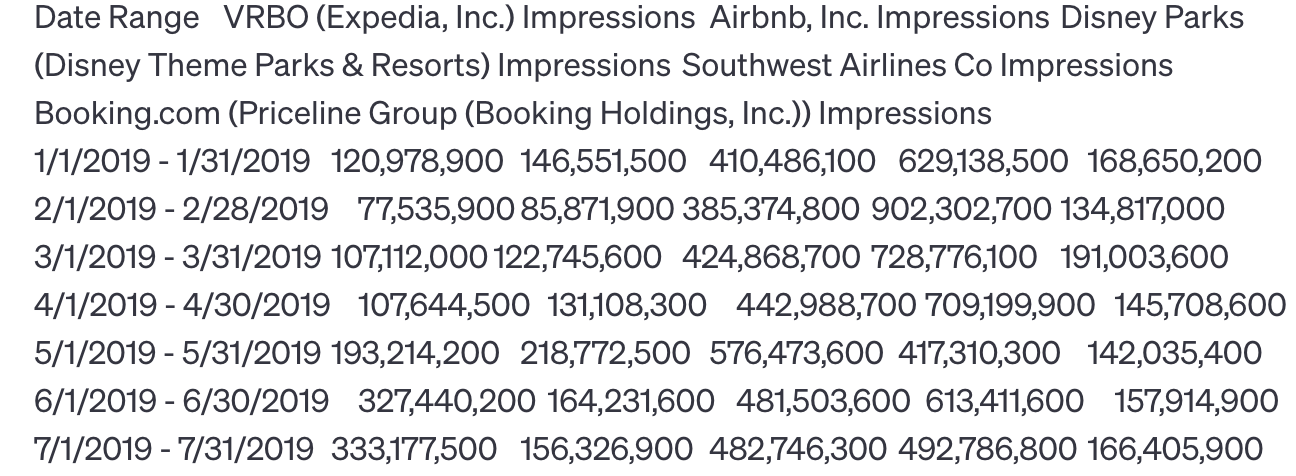
A quick note: you’ll need to download the spreadsheet data powering your chart, then paste it into ChatGPT or Google Bard. Ensure the spreadsheet’s data is clean, with well-defined column headers. Otherwise, copy the entire data sheet and paste it directly into the chatbot. Remember to remove anything that might be identifiable or present a privacy concern. In the following example, we’ll analyze publicly traded companies using publicly accessible data. It will typically look messy, like the image below, but don’t worry, the AI can read and interpret without issue.

Our question is straightforward: what are the media spending patterns of our competitors in comparison to our own? How might we use those insights to adjust our strategy?
Our command prompt for this first chart will be pretty brief and to the point and use our framework from Law 8: The Law of Constructive Command:
- Include Constraints
- Provide a Role and a Framework
- Define the Task
- Provide Context and Background
- Identify the Steps, If Needed
“As a marketing data analyst for Visit Smithville (a DMO), please analyze the following media spending for the last several years. Please provide an overall summary of the data, followed by bullet points of the most notable insights. I will provide the data table in the next prompt, then please provide the requested output.”
The output that results from this prompt looks like this from ChatGPT:
“Here are some key insights extracted from the media spend data for Visit Smithville and the competitive set over the specified period:
- Fluctuations in Advertising Efforts: The monthly impressions vary significantly across the five DMOs and various media channels, indicating different advertising strategies and target audiences. Some months show substantial increases or decreases in impressions, potentially reflecting changes in marketing campaigns or business priorities.
- Visit Sun City’s Consistent Presence: Visit Sun City consistently maintains a high level of impressions across most months, suggesting a sustained and significant advertising effort. This could contribute to its brand visibility and market share.
- Experience Desert Oasis Seasonal Patterns: Experience Desert Oasis impressions show patterns that align with seasonal trends, with higher impressions during peak travel seasons like summer and holidays. This could reflect the company’s focus on promoting travel to its theme parks during these periods.
- Variability in Visit Smithville: Visit Smithville impressions exhibit fluctuations that might relate to changes in travel demand, seasonal variations, or specific marketing campaigns targeting different customer segments.”
Pretty neat, right?
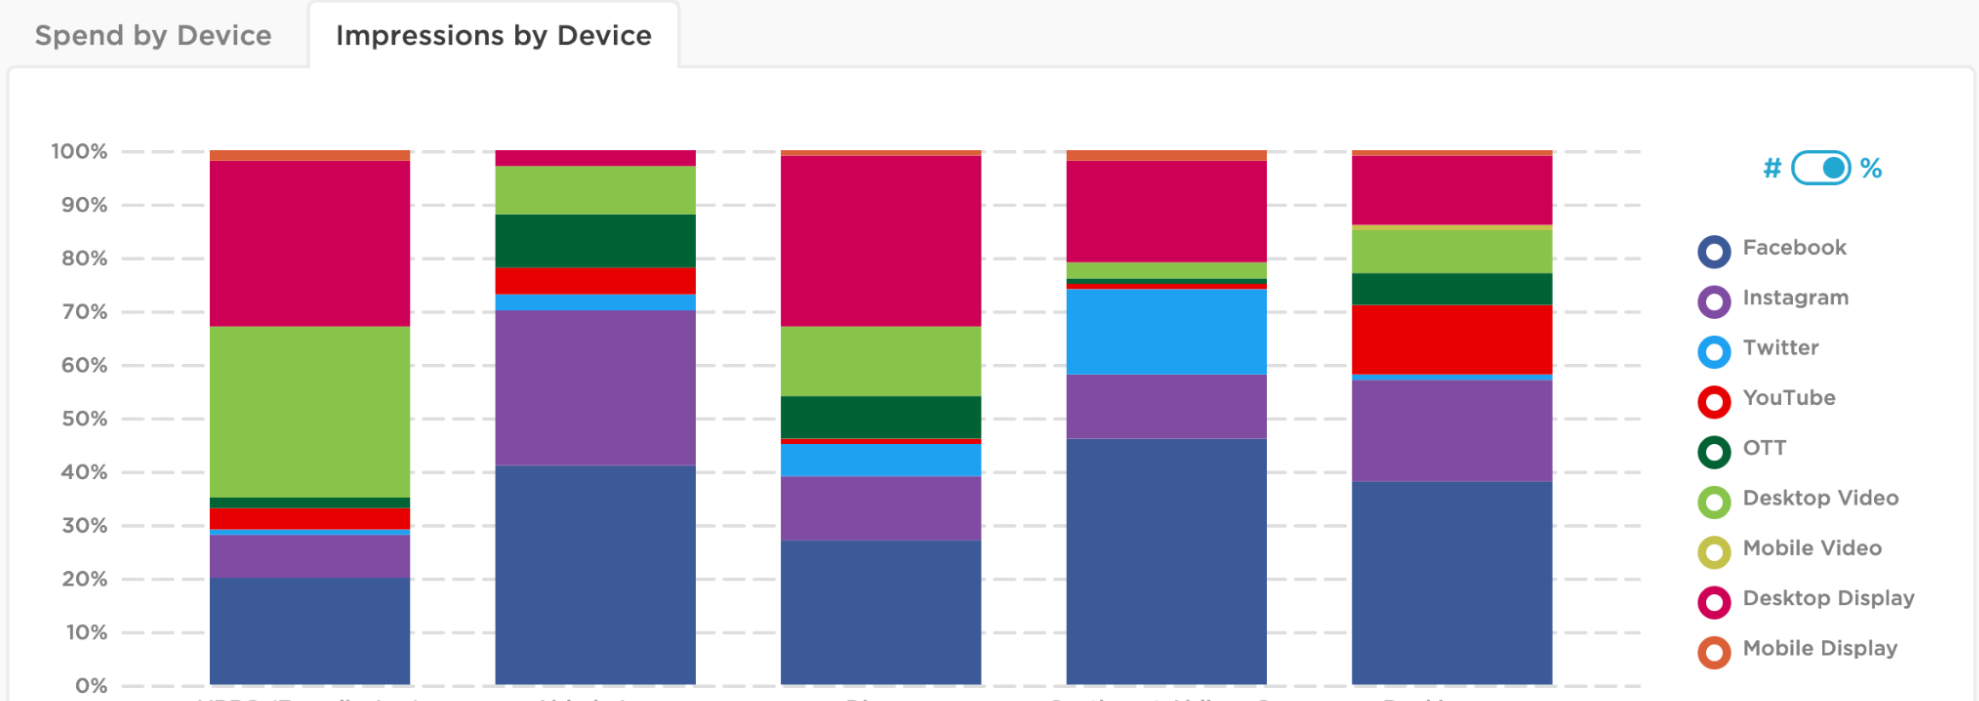
Let’s go another step further. Next, we’ll add the spending of the five DMO’s in our analysis, categorized by media channels.

“Acting again as a marketing data analyst for Visit Smithville, please analyze the following media spend data, organized by media channel allocation. Please provide an overall summary of the data, followed by bullet points of the most notable insights. I will provide the data table in the next prompt, then please provide the requested output.”
From ChatGPT:
“Here are some insights combining the spend and impressions data for each company over the specified period:
1. Allocation of Spend and Impressions:
- Visit Sun City allocates a significant portion of its spend and impressions to “Desktop Video” (57%), emphasizing video advertising on desktop platforms.
- Experience Desert Oasis focuses on “Facebook” (30%) and “Instagram” (24%), leveraging visual content platforms for its advertising strategy.
- Visit Laguna Hills balances its spend and impressions across various channels, with notable emphasis on “Facebook” (27%) and “Instagram” (26%).
- Visit Smithville puts substantial resources into “Twitter” (46%) and “Facebook” (16%) for real-time updates and visual content sharing.
- Visit Catalina Mountain distributes its spend and impressions evenly across various channels, with a significant presence on “Facebook” (29%) and “Instagram” (18%).
2. Spend and Impressions Alignment:
- Visit Sun City’s high spend on “Desktop Video” aligns with its high impressions in the same category (32%), indicating a successful strategy in engaging desktop users.
- Visit Laguna Hill’s investment in “Facebook” and “Instagram” corresponds to its high impressions on these platforms (41% and 29% respectively), reinforcing the brand’s social media presence.
- Experience Desert Oasis’ spend and impressions are consistent with its overall marketing mix, with a balance across channels.
- Visit Smithville’s heavy spend on “Twitter” is mirrored by its high impressions on the platform (16%), showing effective real-time engagement with customers.”
You can even ask ChatGPT to combine the last two data sets into one more comprehensive analysis! Or, ask what the AI thinks you should consider, given the data analysis provided. A command prompt, in this case, could be pretty simple:
“If you were the marketing team at Visit Smithville, what adjustments to media channel strategy would you consider to take advantage of the insights presented above?”
Here’s what ChatGPT provided as a response:
- Continue to Emphasize Real-Time Engagement on Twitter:
Visit Smithville should maintain its strong presence on Twitter, given its real-time engagement capabilities and the need for timely updates. This platform can provide information and customer service and promptly respond to passengers’ queries. - Leverage Facebook and Instagram for Visual Storytelling:
Visit Smithville should capitalize on “Facebook” and “Instagram” success by focusing on visual storytelling. Sharing captivating visuals of destination, customer experiences, and behind-the-scenes content can resonate well with the audience and drive engagement. - Diversify Content on Facebook and Instagram:
While Visit Smithville has seen success on “Facebook” and “Instagram,” diversifying content is crucial. This could include user-generated content, destination highlights, employee stories, and interactive posts to foster community and engagement. - Explore Video Content:
Given the success of “Desktop Video” and the overall trend toward video consumption, Visit Smithville could invest in video content across platforms. This could involve creating short travel guides, virtual tours, testimonials, and even behind-the-scenes videos of the destinations attractions.
Imagine the possibilities for your organization! With the help of a $ 20-a-month AI tool like ChatGPT, you can ensure that those significant dollar investments made in information and data resources are far better utilized. While these tools might not replace dedicated data scientists and data analysts for more complex undertakings, they are the perfect fill-in for the other 80-90% of everyday data analysis tasks the modern DMO needs to complete.
Up next, we’ll explore how AI can unlock the ability to innovate and create before bringing everything home in the final Law!
Other blogs in this series:
Law 1: AI is the Tool, Not the Craftsman
Law 2: Humble Beginnings and Law 3: Transparency
Law 4: The Law of the Imperfect Mirror
Law 5: The Law of Liberated Potential and Law 6: The Law of Collective Empowerment
Law 7: The Law of the Artful Inquiry
Law 8: The Law of Constructive Command
Law 10: The Law of Democratized Innovation
Law 11: The Law of Creative Exploration
Law 12: The Law of Ascendency
Note: This collection of “laws” on AI incorporate insights from my research and writing on the topic. To make it as memorable as I could — and to demonstrate one of the many powerful utilities these tools offer — I asked ChatGPT 4.0 to style my writing in the voice of Robert Greene, author of the best-selling book “The 48 Laws of Power.” I hope you will agree that each of the Laws is a bit more memorable with this distinct style being employed. It’s crucial that we embrace these new tools and transparently acknowledge how they improve our critical thinking and public sharing of ideas.


